- 01
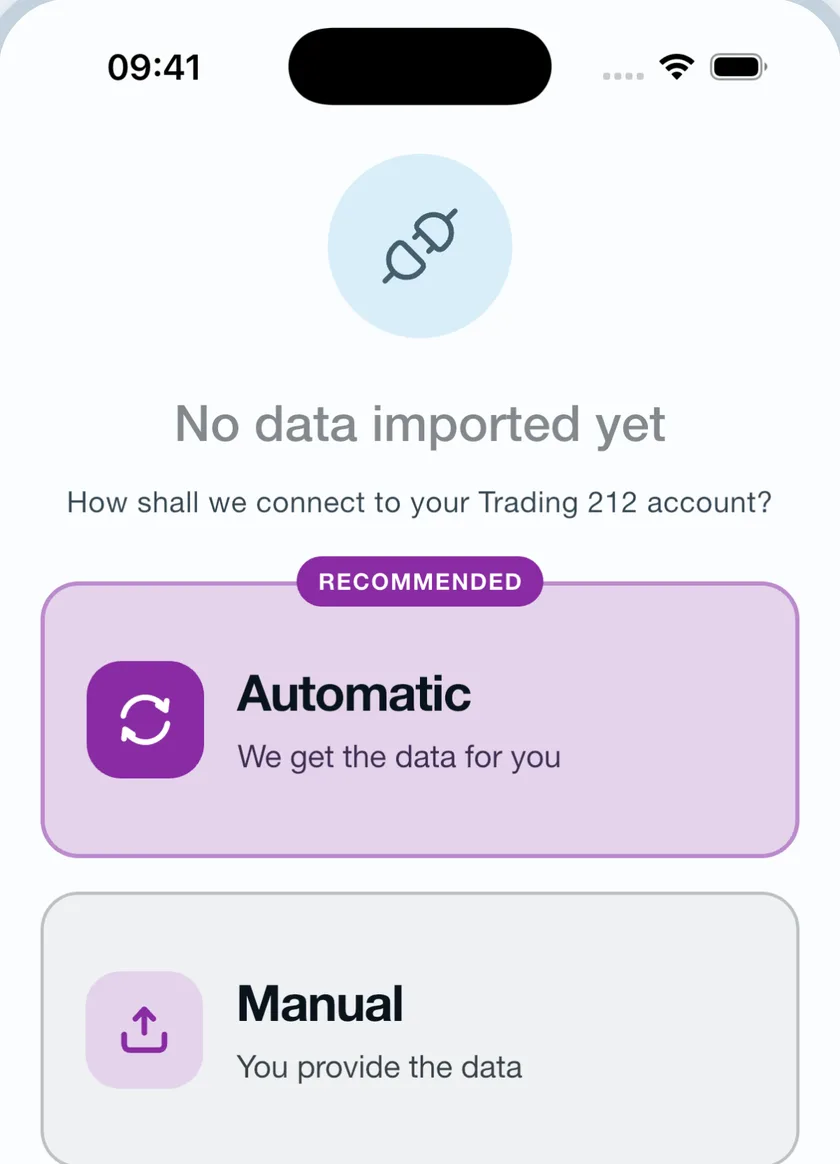
Automatically connect to your Trading 212 account
- 02
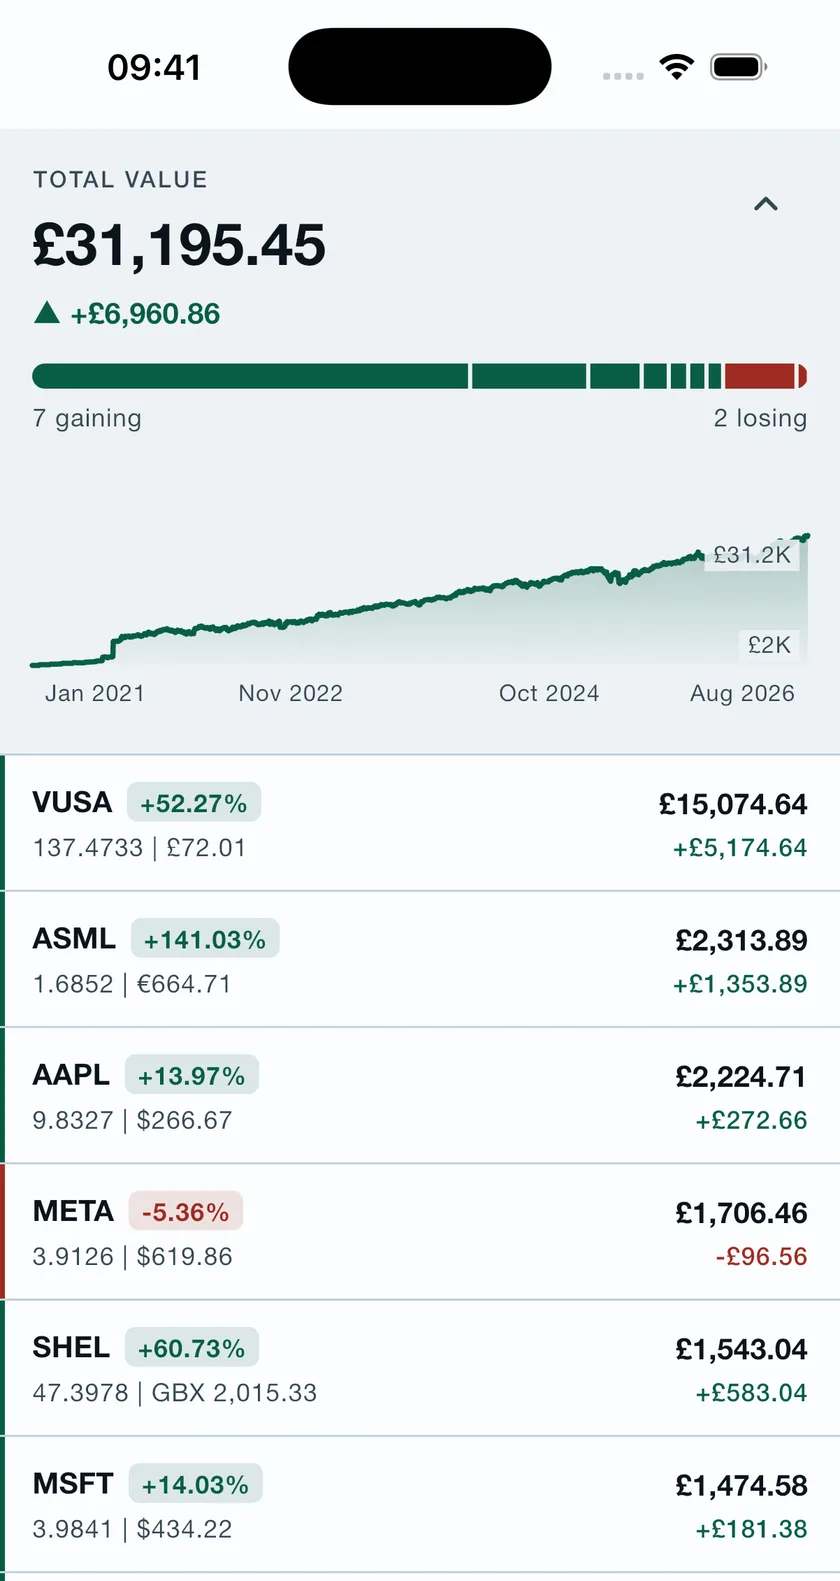
Your open positions
- 03
And your closed positions
- 04
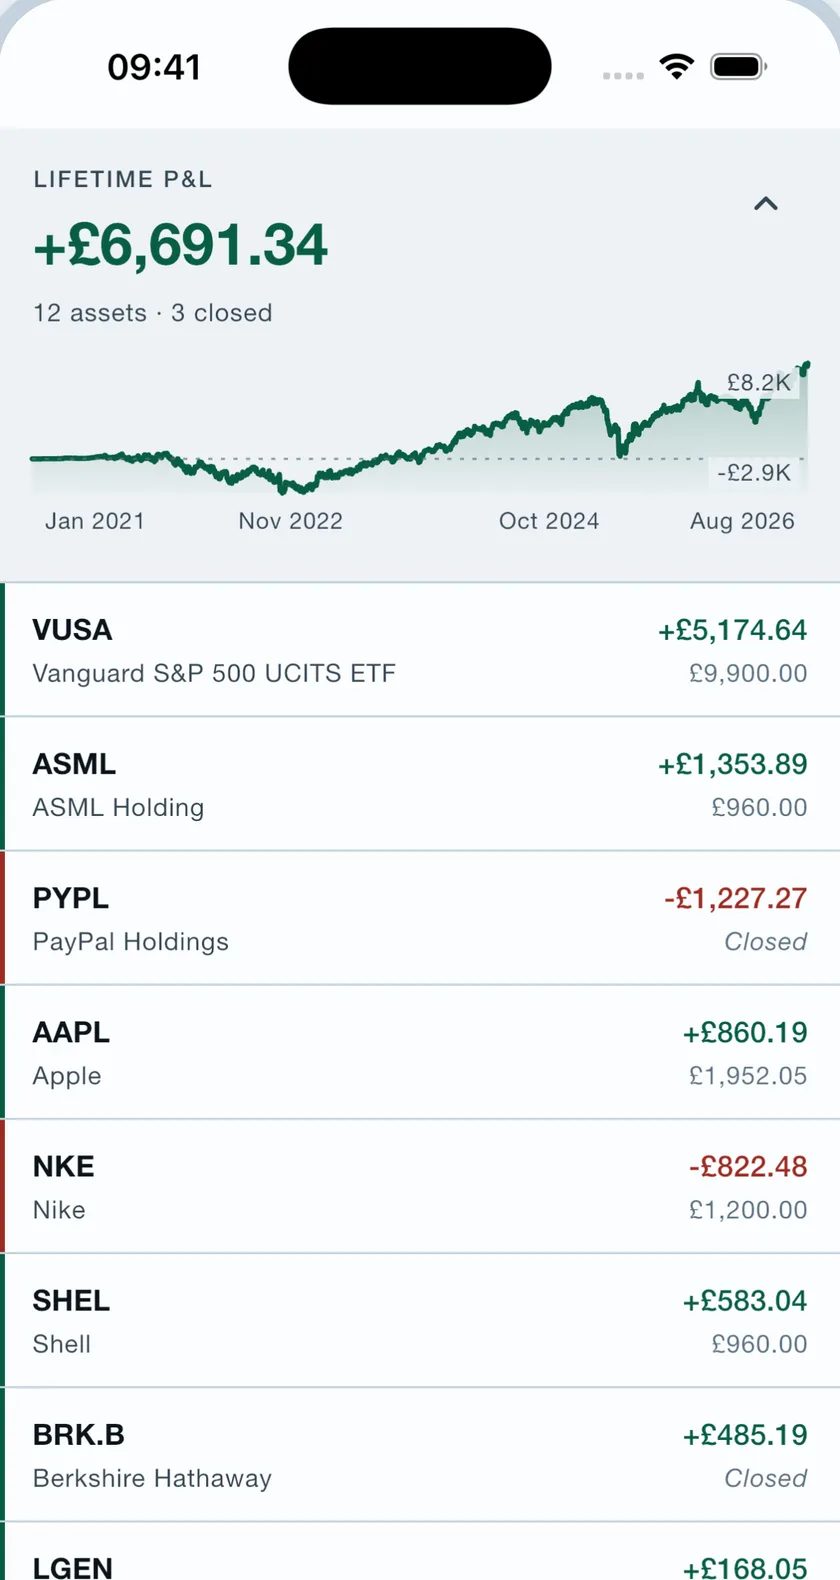
How much you won on each asset
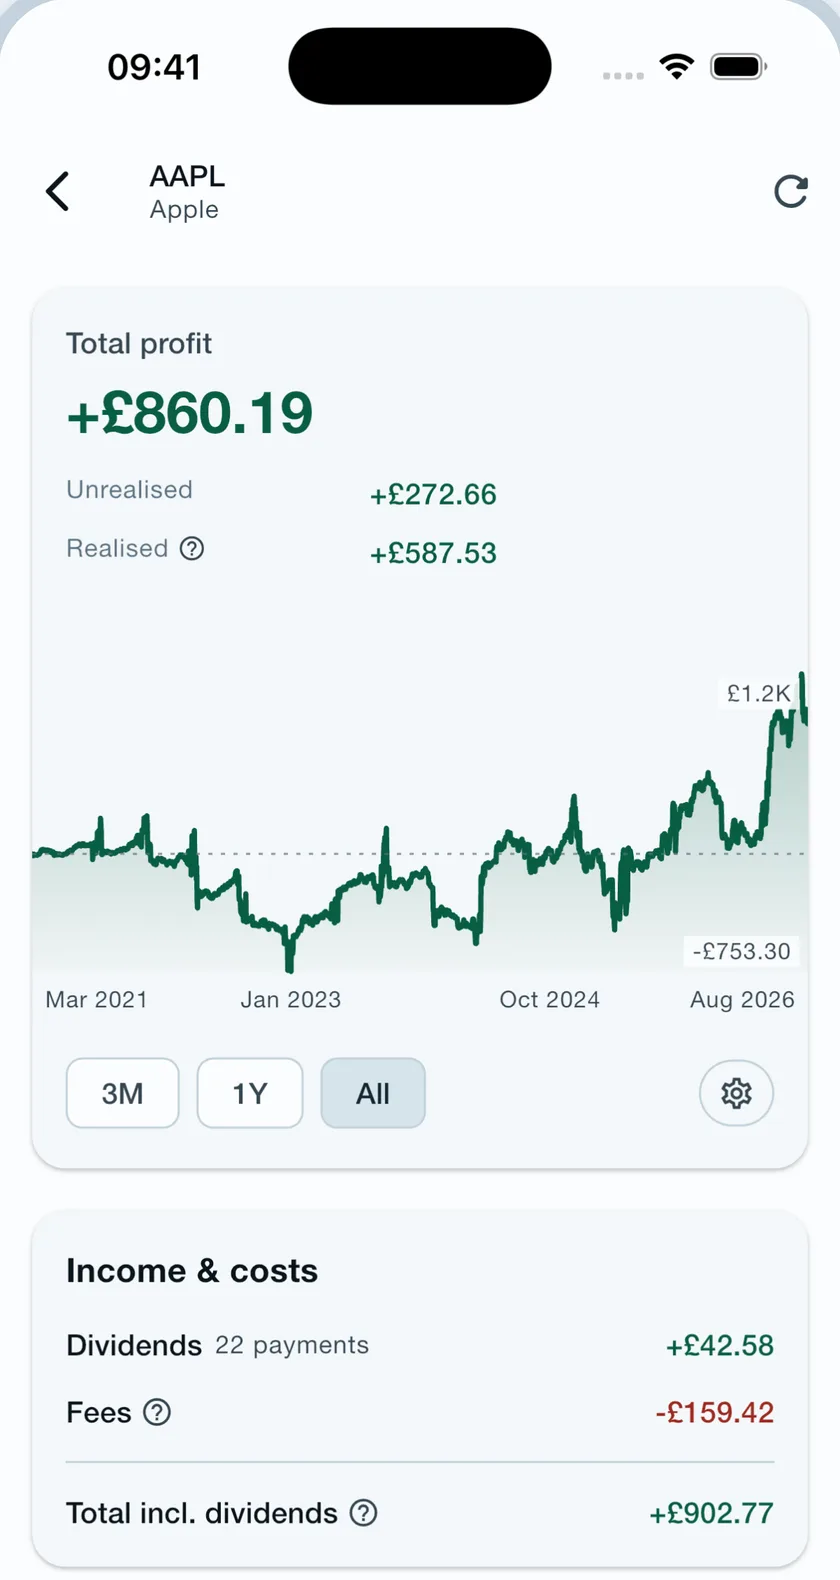
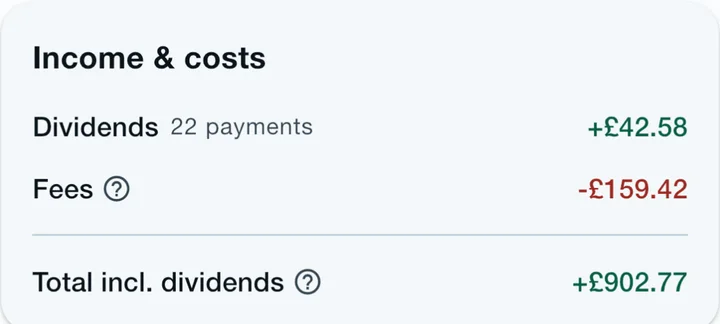
- 05
All your fees visualised and broken down
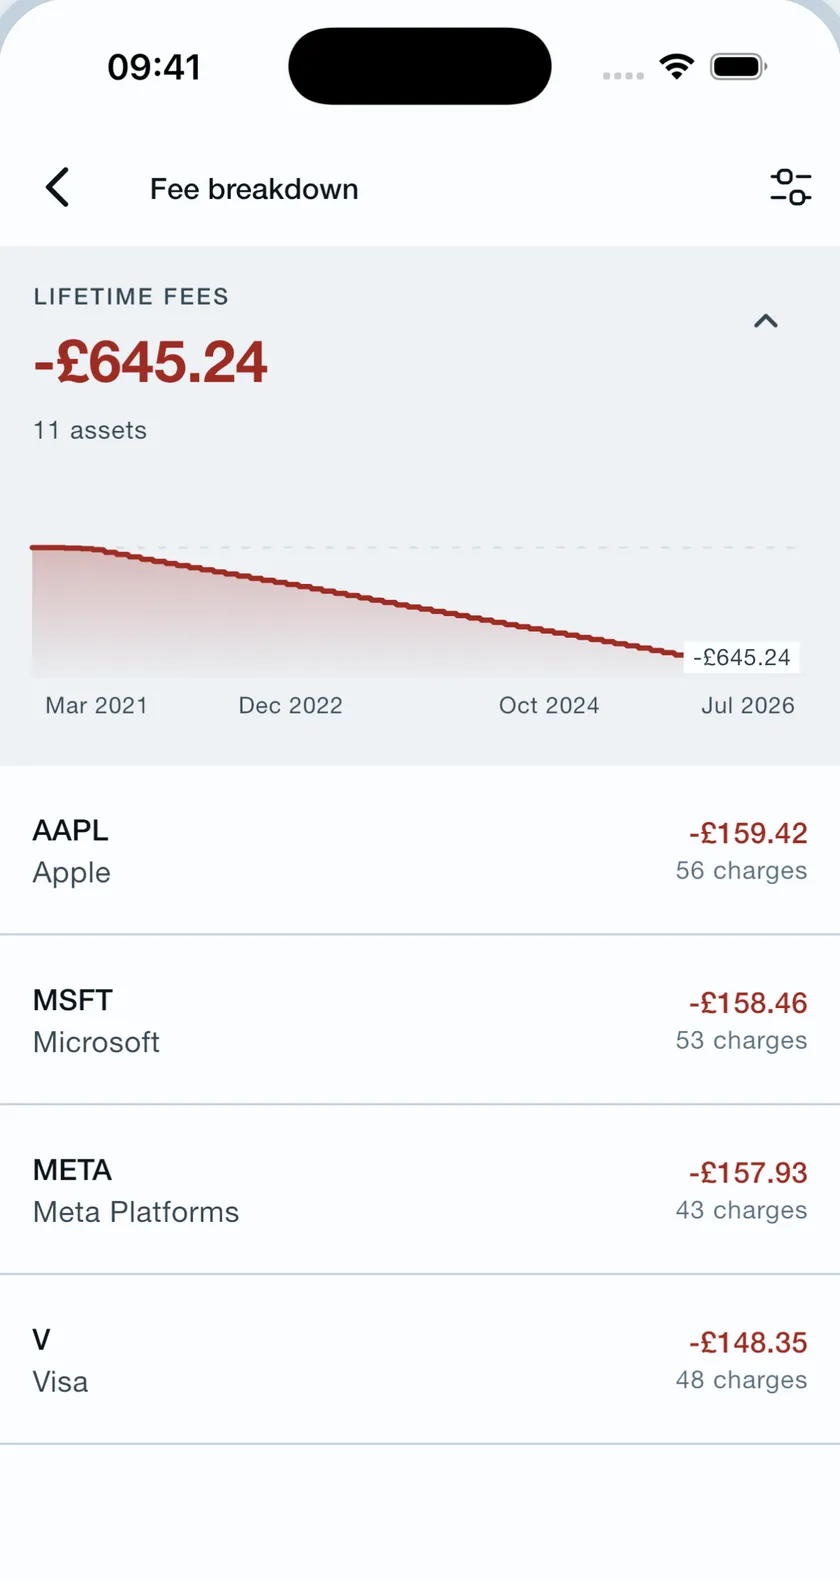
- 06
Can you beat the indexes?
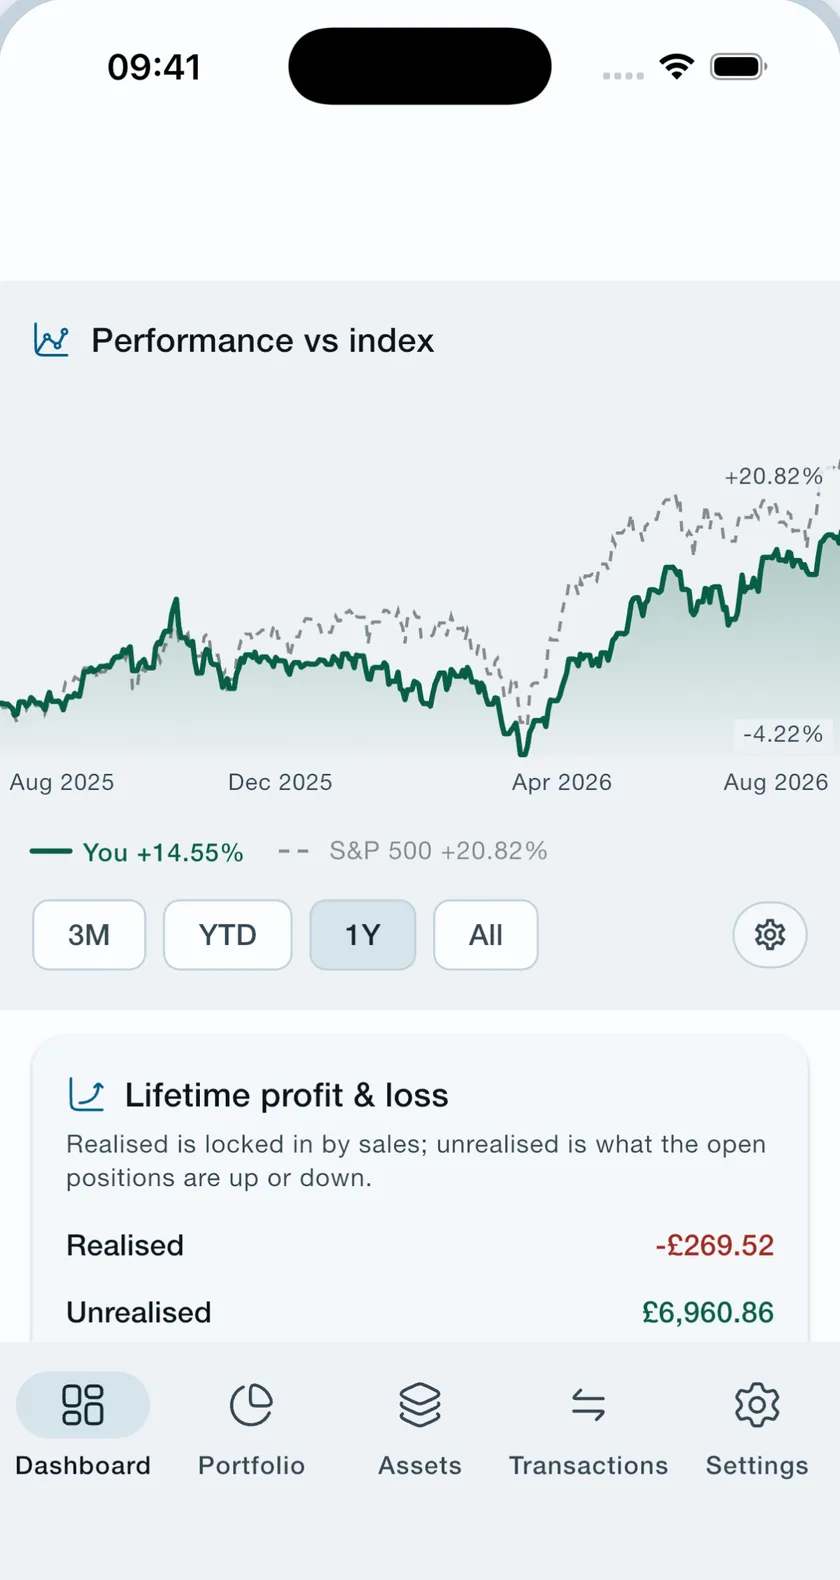

- 07
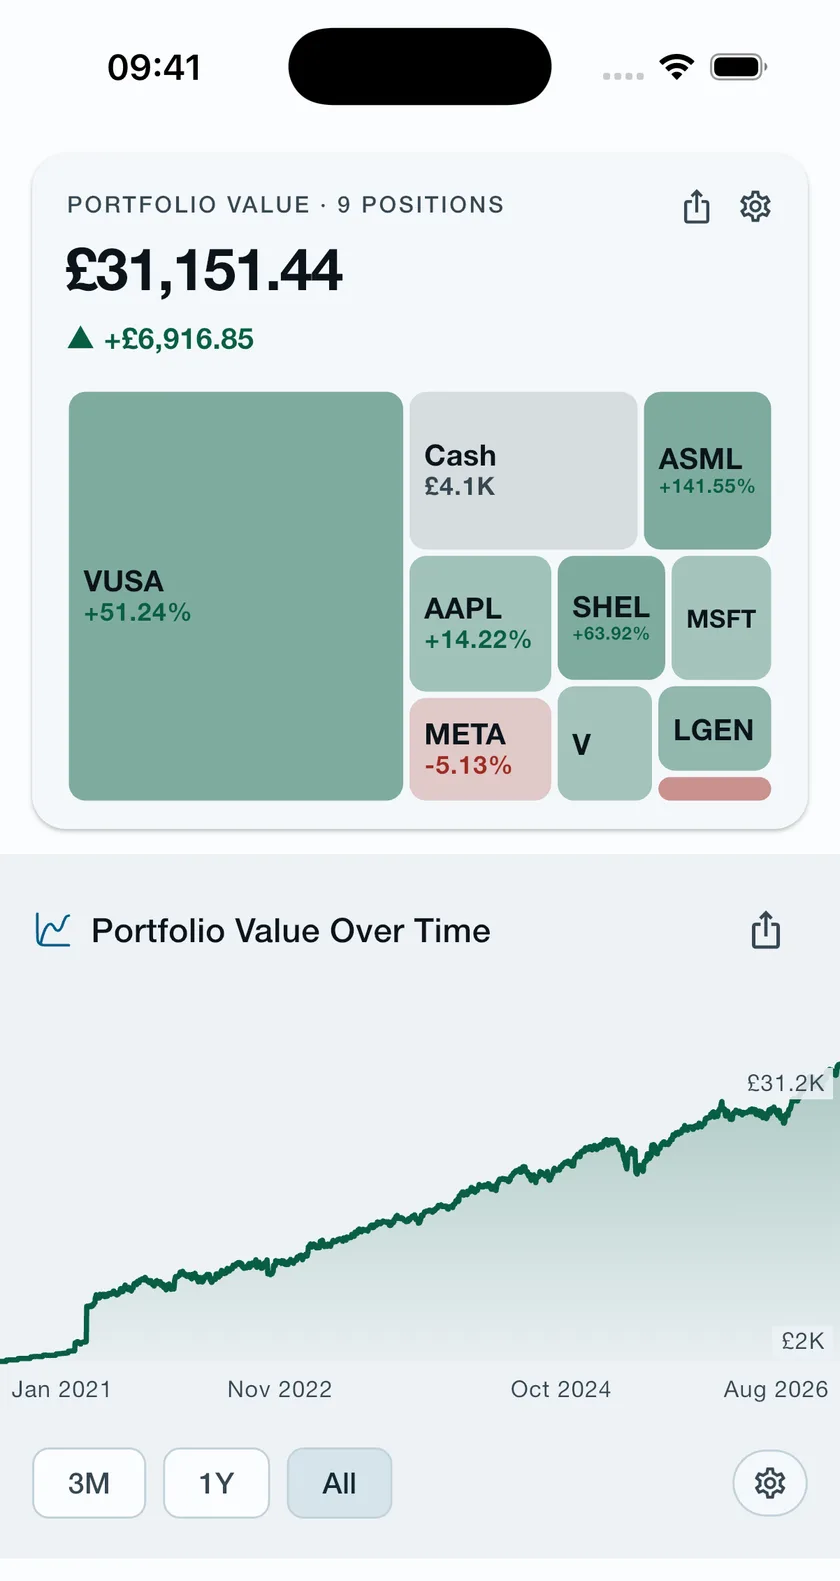
Your data visualised beautifully
- 08
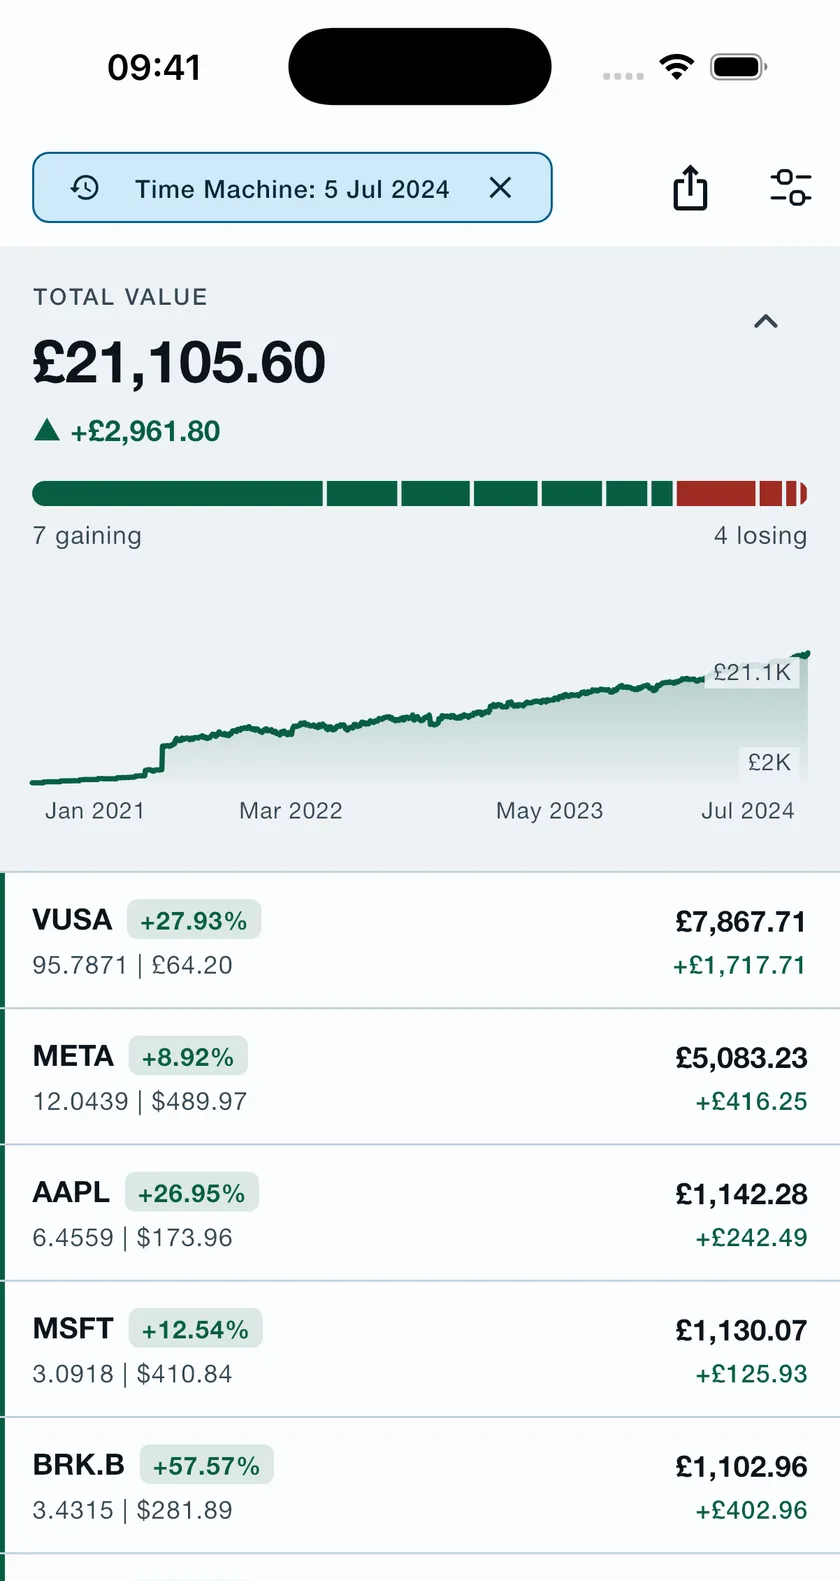
Featuring “Time Machine” — Relive your best moments

- 09
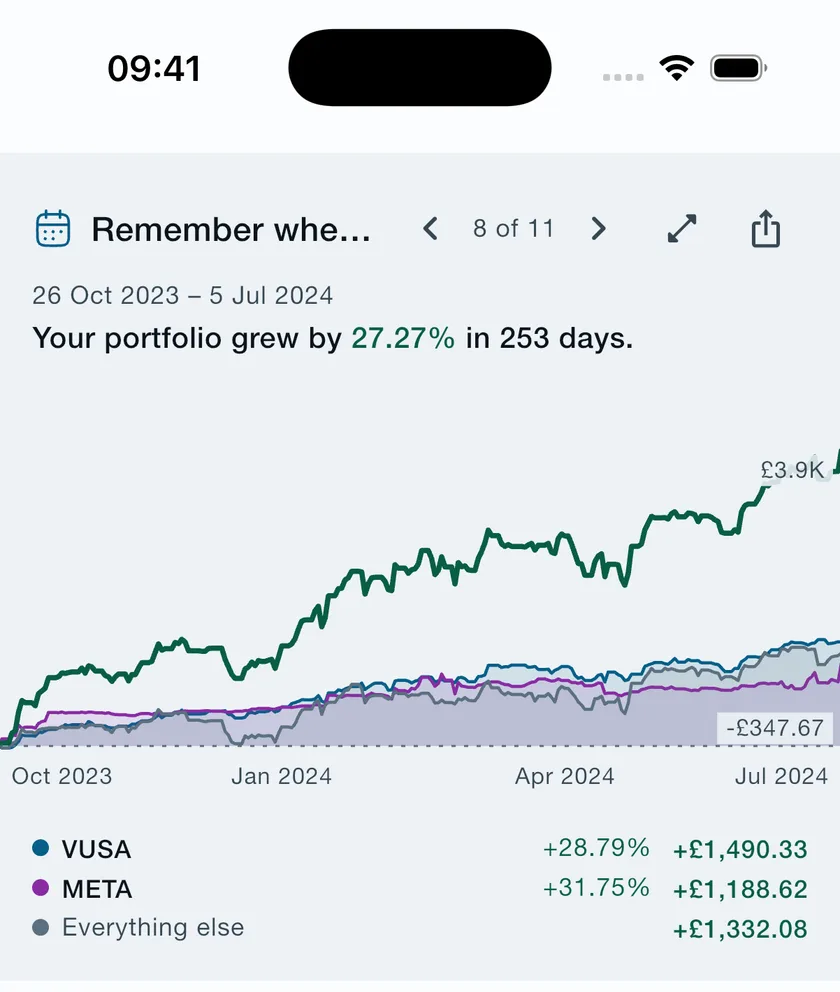
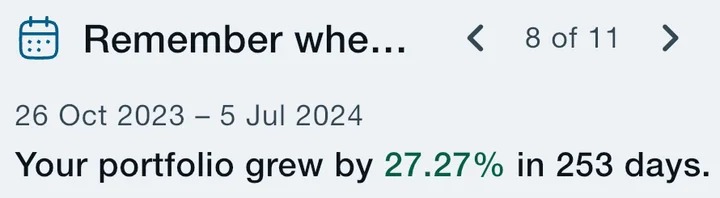
Tracker 212 finds your life’s greatest hits
- 10
Private, secure. Your data is held only on your device.
See your Trading 212 Performance
How much did you actually win on each stock?


No account or sign-upNo adsYour database stays on your device
Everything else it tracks
The details, done properly
Stock splits, handled
A split rescales the shares you held on the day it happened and leaves every money figure exactly as it was — so a ten-for-one never shows a holding at a tenth of its value.
Multi-currency, historical FX
GBP, USD, EUR — every transaction converted at the rate on the day it happened, not today’s.
Dividends & interest
Every payment on the record — dividends and interest, counted separately from your gains, lifetime.
Built for Trading 212
Reads the export formats as they come, including a pie’s many small fills, which are put back together into the trade you actually placed.
No account, no sign-up, no ads
No backend — your holdings are never uploaded to us
Your API key stays on your device and talks only to Trading 212
Questions, answered
Frequently asked questions
Is Tracker 212 an official Trading 212 app?
No. Tracker 212 is an independent, unofficial app — not affiliated with, endorsed by, or sponsored by Trading 212. It only reads data you provide yourself: your CSV exports, or a read-only API key you create in your own account.
How does it get my trading history?
Two ways in: connect a read-only API key and new activity imports itself, or import the CSV exports you already download from Trading 212. Multi-fill orders are merged, and deposits, withdrawals, dividends, interest and fees are all accounted for.
Is a read-only API key safe?
A read-only key can only read your history — it cannot trade, move money or change your account. You generate it yourself in Trading 212 and can revoke it there at any time. The key is stored in your device’s secure storage and is used only to talk to Trading 212 directly.
Where is my portfolio data stored?
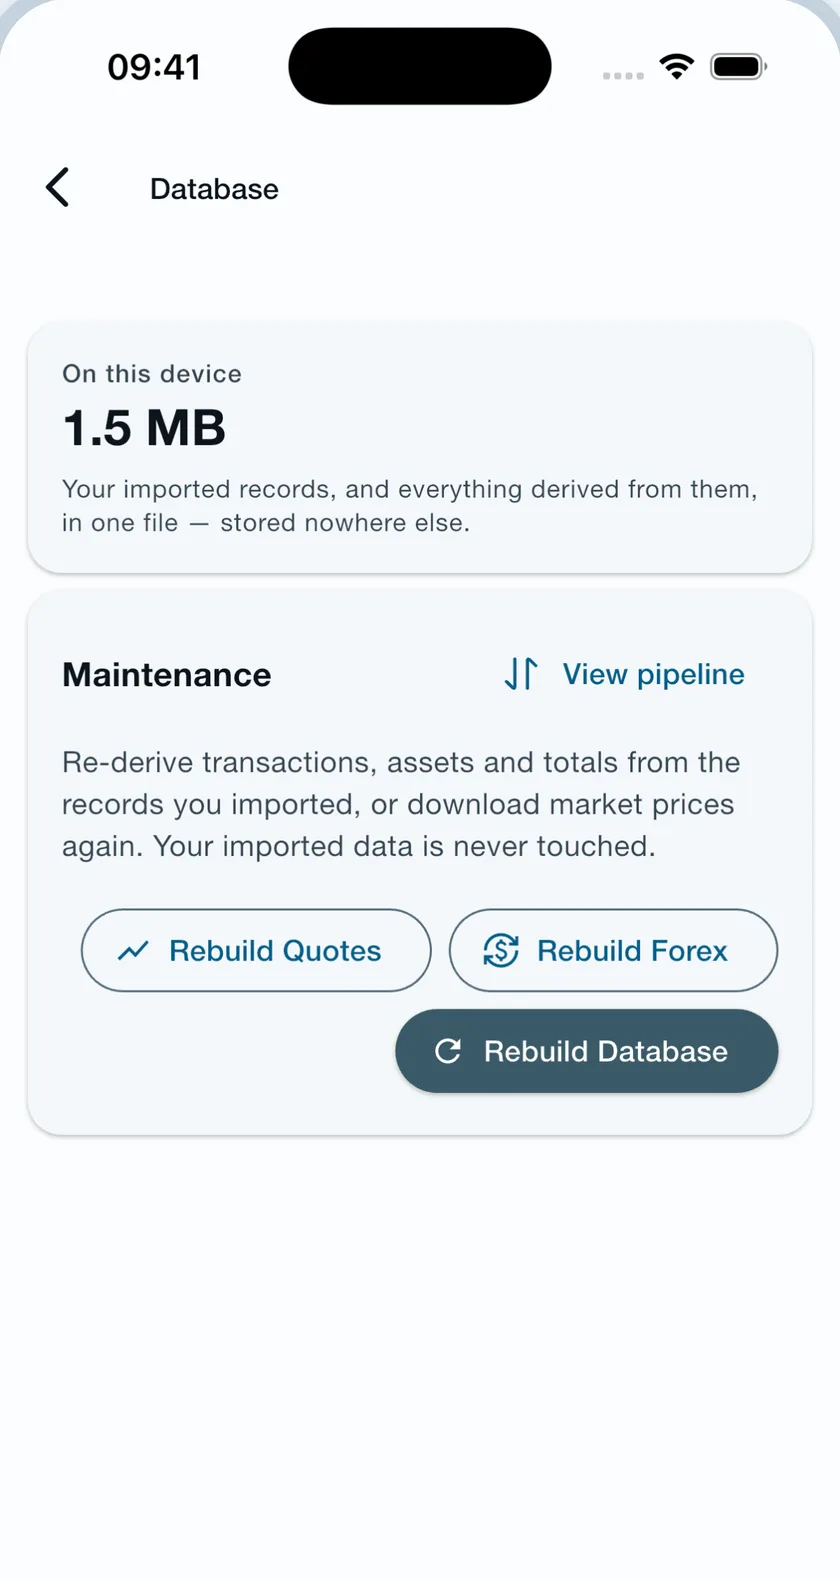
In one database file on your device. There is no account, no sign-up and no backend — your holdings are never uploaded to us. The app does make outbound requests: daily prices and exchange rates, carrying only ticker symbols, currency codes and dates; a column header and a sample value if an imported CSV column cannot be recognised; and anonymous usage and crash data. Never your quantities, balances or amounts — the privacy policy lists every one of them.
What does “true lifetime P&L” mean?
Realised and unrealised gains combined, computed from your very first trade and including positions you have already closed — with what you paid converted at the rate that applied on each trade’s own date, and what your open positions are worth today converted at today’s. Dividends, interest and fees are counted separately rather than folded in: each asset also states its total including dividends, so you can read a holding with and without the income it paid you.
What does the heat map show me?
Your open positions as one picture — sized by value, tinted by how far each one is ahead or behind on what you paid for it, with cash given a tile of its own because it is part of the total above the map. Holdings too small to compare are gathered into one tile so the map does not end in slivers you cannot read. Below a certain size a tile prints no ticker at all: the type would not be legible, and the patch of colour is a true statement of size on its own.
What Tracker 212 does with your Trading 212 history
Tracker 212 is a portfolio tracker built specifically around Trading 212. Give it a read-only API key to fetch your account for you, or hand it the CSV exports you already download, and the app rebuilds your complete investment history — every buy and sell, every dividend, every deposit and withdrawal, every fee and foreign-exchange move since your first trade. The result is the number the broker app never quite shows: your true lifetime profit and loss, realised and unrealised, per holding and across the whole portfolio.
That history powers everything else: a dividend tracker with every payment on record, a fee breakdown that shows what each charge actually cost you, portfolio value from your first trade rather than from the day you installed the app, and an honest time-weighted comparison against the S&P 500. Invest and ISA exports import the same way, pie orders merge back into the orders you placed, and what you paid for a foreign holding converts at the rate that applied on the day of the trade. Whether you are tracking dividend income towards early retirement or just want to know whether the index would have done better, both answers come out of the same rebuilt history. That history is also what a spreadsheet built from those same exports quietly gets wrong.
Because the whole history is there, it can be walked rather than only totalled. Your open book is drawn as a heat map, so the shape of the portfolio is one glance rather than a scroll. And any past date can be rebuilt as it stood that day — the positions you held, the prices they closed at and the exchange rates that applied. And the app reads your own profit line for the moments in it, so the biggest runs, drops and recoveries in your history are things it finds and shows you rather than things you go looking for.
And it is private by design: your portfolio lives in one database file on your device. There is no sign-up, no account and no backend — your holdings are never uploaded to us. Read exactly how data is handled in the privacy policy, or get in touch via support.
On iOS & Android
No more spreadsheets — The missing Trading 212 tracker app
Get Tracker 212 and see your whole Trading 212 history properly.