Your Trading 212 CSV export, explained
Trading 212 lets you export your account history as a CSV file. It has everything you need to work out what your investing has really done — and almost nothing in a shape you can read. Here is what is actually in it, and what it takes to turn those rows into a portfolio.


How to export your history
- Open Trading 212Log in, then head to History.
- Choose Export statementThe export button sits above the list.
- Leave every data type tickedOrders, dividends, interest and transactions all matter.
- Pick the periodFrom your first trade to today.
- Tap ExportTrading 212 emails you the file — it can take a few minutes.
Prefer not to handle files? A read-only API key you generate in Trading 212 lets the app fetch the same export for you and keep it current — it reads your history and can never place a trade.
What the file contains
Every row is one event in your account, labelled with an Action. Trade rows carry the ticker, the ISIN, the instrument name, the number of shares, the price per share, the exchange rate that applied and the total that hit your account. Alongside them sit the charge columns, each one its own field rather than a lump sum.
Orders
- Market buy
- Market sell
- Limit buy
- Limit sell
- Stop sell
Income
- Dividend (Ordinary)
- Dividend (Dividend manufactured payment)
- Interest on cash
- Lending interest
Cash & corporate
- Deposit
- Withdrawal
- Currency conversion
- Stock split open
- Stock split close
The charges, column by column
These are the fields worth knowing about, because they are where the cost of investing actually hides:
- Currency conversion fee
- Transaction fee
- Finra fee
- Stamp duty reserve tax
Three things about the file that catch people out
Action is the only field that says what a row is. A purchase, a dividend, an interest payment and the opening half of a stock split all arrive looking much alike otherwise, so every figure you get out of the file depends on reading that one column correctly first.
Charges are per row, and each has a currency of its own. A fee is never a lump sum in the total — it is its own field, paired with its own currency field, so a single fill can carry several separate charges denominated in something other than your account currency.
An export covers a period, not an account. You choose a date range, so a complete history is normally several files, and anyone who exports generously ends up with files that overlap at the edges.
Those are properties of the file, true of it whether or not a spreadsheet is ever opened. What they do to a formula once you paste them into one is the subject of what a spreadsheet quietly gets wrong.
Drop the files in and let them merge
Import one export or ten. Orders filled in pieces are merged back into the trade you actually placed, amounts are normalised, and anything already imported is recognised rather than counted twice.
If you would rather not handle files at all, a read-only API key fetches the same history for you and keeps it up to date. It reads and nothing else — it cannot place a trade or move money — and either route ends in the same database on your device.
Rows become a portfolio
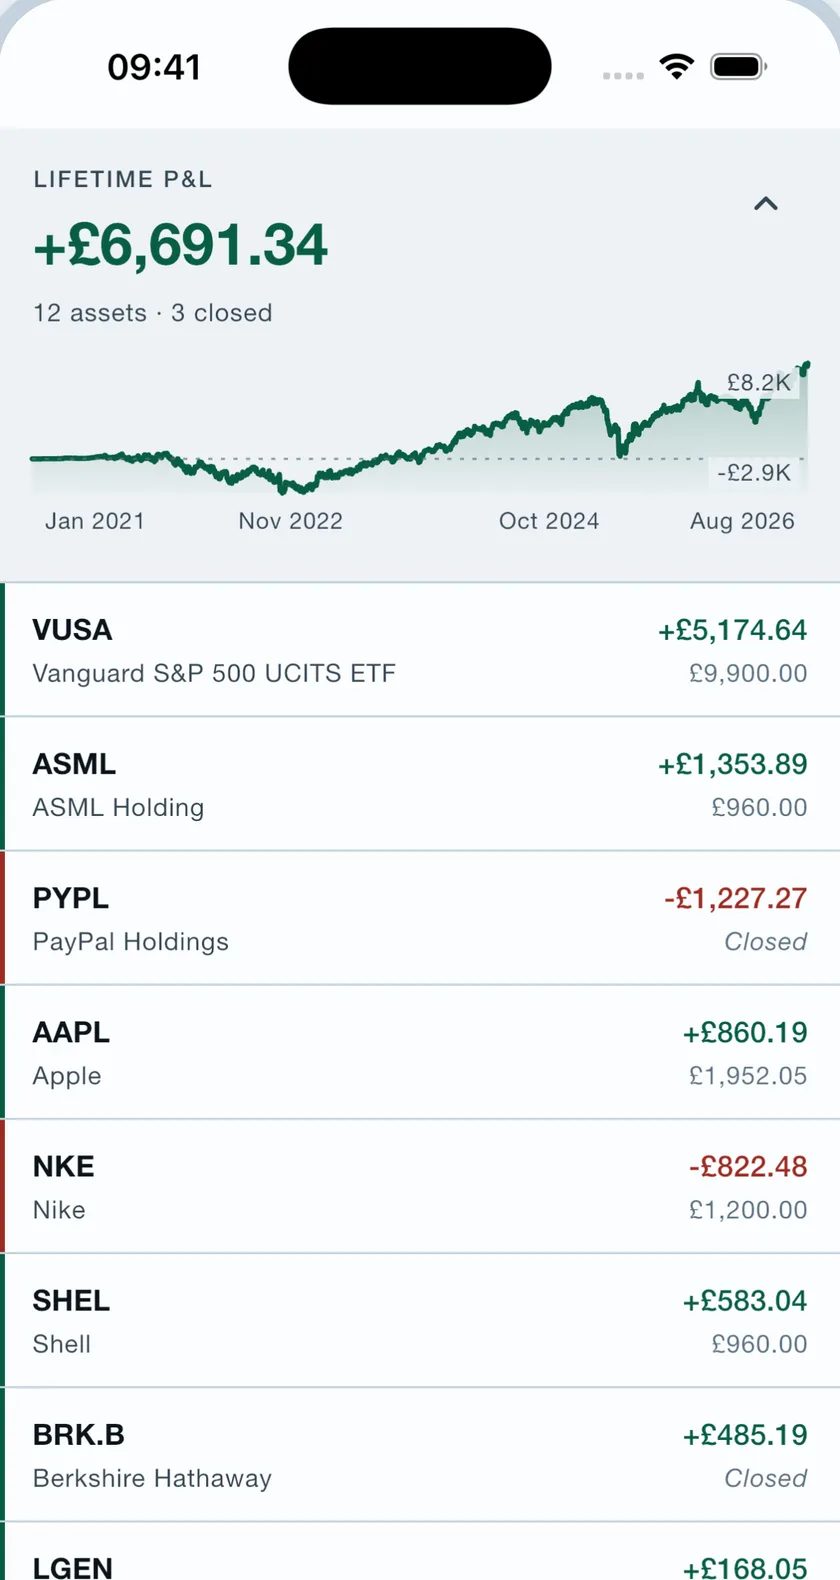
The list at the top of this page is what comes out: one row per asset rather than one per fill, ranked by what it made, with the positions you closed labelled instead of dropped. In the app that list carries the figure they add up to above it — one number across everything you have ever traded, over a profit line that starts at your first trade.
Everything is rebuildable from the records you imported — and every figure can be traced back to the rows it came from.
Frequently asked questions
What is in a Trading 212 CSV export?
One row per event in your account history, each labelled with an action. Buys and sells carry the ticker, ISIN, name, share count, price per share, exchange rate and total, plus separate columns for the charges that applied. Dividends, deposits, withdrawals, interest and currency conversions get their own rows and their own action names.
What happens if a new export has a charge column the app has never seen?
It is still counted. Charge columns are recognised by what they are named rather than by where they sit, so a year whose export carries an extra fee or tax is read and totalled with the rest instead of being quietly dropped, and a column that moves between files is followed rather than lost. A header the app cannot place at all is the one case where it asks for help reading your file.
Do I need more than one export file?
Usually yes — exports cover a date range, so several years of history normally means several files. Import them all and Tracker 212 merges them into one continuous history, ignoring anything it has already seen.
Is importing a CSV safer than connecting an API key?
Both keep your portfolio on your device. A CSV import means you hand over a file you exported yourself; a read-only API key means the app fetches the same export for you and can never place a trade or move money. Whichever you choose, the resulting database is stored on your device — there is no backend and your holdings are never uploaded to us.
Does anything from my file leave my device?
Your records do not. The columns in a standard export are recognised by name, so a normal import needs no help. When a column cannot be recognised, parts of the structure — such as a header and sample values — may be sent to an AI service to work out what that column means, and asset identifiers such as tickers may be sent to identify an instrument. Your portfolio itself is never uploaded.
Turn the export into an answer.
Import the CSVs you already have, and see what your investing actually did.
Read-only API key
Connect with a key that reads your history and can never place a trade.
Read more →Spreadsheet vs app
What a spreadsheet gets right about your portfolio — and the six things it quietly gets wrong.
Read more →Portfolio tracker
Every position you have ever held, the shape of the book as a heat map, and any past date you like.
Read more →