Your portfolio, in a spreadsheet
A spreadsheet will happily hold your Trading 212 export. The trouble is not the arithmetic at the end — it is the six things in the data that have to be handled before the arithmetic is worth anything.


What a spreadsheet is genuinely good at
It is worth being fair about this. If you hold a handful of positions in one currency, bought them outright and have not sold anything, a spreadsheet is a perfectly good portfolio tracker — and it is yours, offline, and free. Nothing below argues otherwise.
What follows is what changes once your history gets longer: several years of exports, more than one currency, orders that filled in pieces, positions you closed and reopened, and at least one stock split. Each of these is a place where a sheet keeps producing a number, but the number stops being true.
Six things that quietly go wrong
- 01
One order arrives as many rows
A single order can be filled in pieces, and each fill is its own row. Count rows and you overstate how often you traded; average their prices flat and you misstate what you paid. They have to be grouped back into the order you actually placed, weighted by quantity.
- 02
The columns are not the same in every file
Trading 212 shapes the export to the period’s content. A stretch with only deposits and interest ships without instrument columns at all; a dividends-only period can arrive without the ID column. Even the fee columns change between yearly exports — both which ones appear and what order they come in. A formula pinned to column H does not survive that.
- 03
Exchange rates belong to the day, not to today
A holding bought in dollars cost what it cost on the day you bought it. Convert the whole history at today’s rate and you have invented a number that reconciles with nothing — not your statement, not your gain. Every transaction needs the rate that applied on its own date, and some currencies are quoted in minor units that have to be resolved through their major unit first.
- 04
A split changes your share count without a trade
A split lands as two rows: a close in the old units and an open in the new. Shares move, money does not. Miss it and a ten-for-one split values a holding at a tenth of what it is worth, or shows a position you closed entirely as a negative share count.
- 05
The obvious cost average re-prices shares you already sold
Averaging every purchase across the whole history is the natural formula, and it is wrong for any position you closed and later reopened: losses you already took get re-billed against the shares you hold now. A moving average — where a sale removes shares at the average as it then stood — is what a broker statement actually shows.
- 06
Unrealised gains need prices you do not have
Your export says what you paid, never what it is worth now. A live figure needs a price for every holding, on the right date, in the right currency — and a historical value chart needs one for every day since your first trade.
The common thread: none of these produce an error. The sheet keeps calculating, the totals keep looking reasonable, and nothing tells you which of your figures stopped being true — which is what makes them expensive.
The work happens before the totals
Tracker 212 imports the same export you would paste into a sheet, then does the parts a sheet cannot: fills merged back into orders, each amount converted at the rate from its own date, split events applied as a ratio that moves shares without moving money, and cost tracked on a moving average.
Import overlapping files and rows already seen are recognised rather than counted twice — so you can export generously instead of carefully.
Numbers you can hand someone
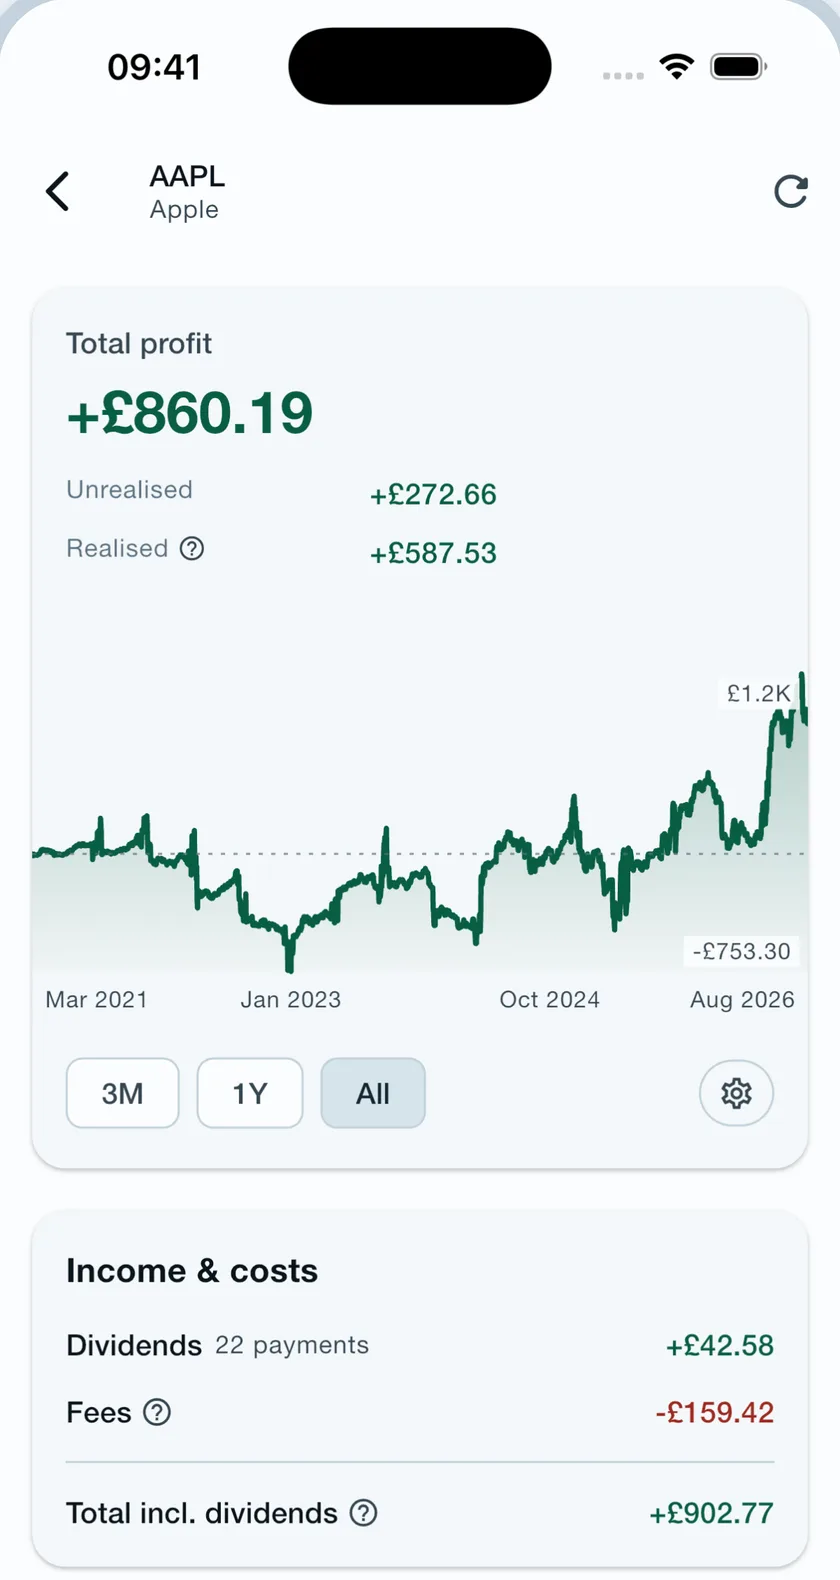
What comes out is the thing the sheet was reaching for: profit split into realised and unrealised, every dividend counted, every charge totalled, and a line that goes back to your first trade, not to the day the sheet was started — for the whole book, and for one holding at a time.
And it stays rebuildable — no total is a value someone typed in once. Each one points back at the imported rows underneath it, and the whole database can be re-derived from those rows whenever you ask.
What was it worth on a day you did not plan for?
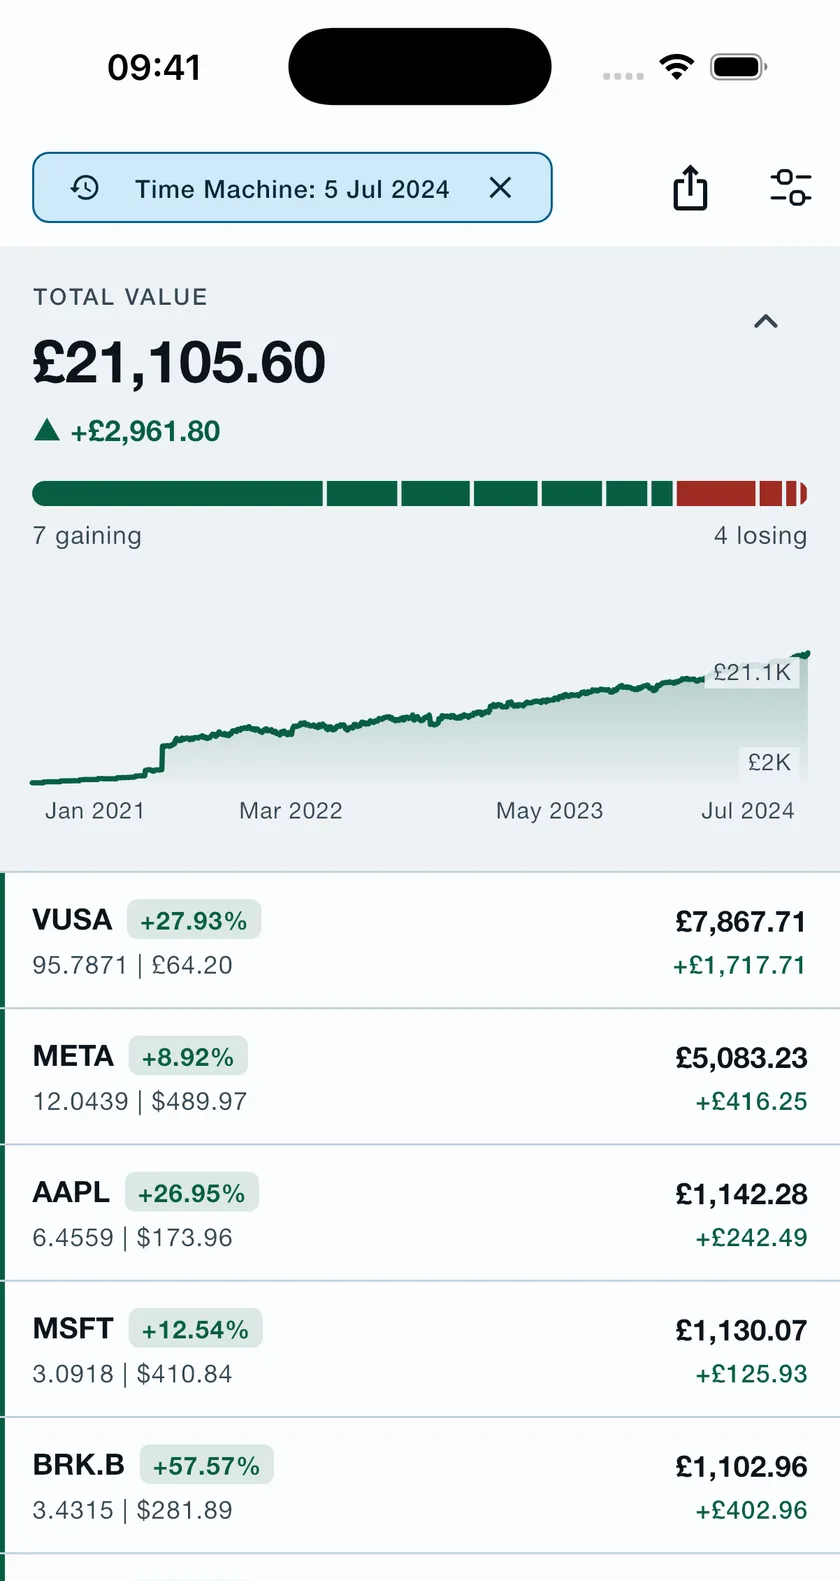
A spreadsheet holds one snapshot: whatever you last pasted into it. Asking what the portfolio was worth on one particular day in 2024 needs a closing price for every holding on that date and an exchange rate for every currency on that date — one price per holding and one rate per currency, multiplied by however many days you might ask about. That is the sixth gap above, asked once per day.
Those prices and rates are fetched once and kept, so any past date is a question you can simply ask. It is also what a value chart running from your first trade is made of: the same daily walk, drawn rather than read off one day at a time.
Frequently asked questions
Can I track my Trading 212 portfolio in a spreadsheet?
Yes, and for a handful of buy-and-hold positions a spreadsheet is genuinely fine. It starts to mislead once you have several years of history, more than one currency, orders that filled in pieces, or a stock split — because each of those needs handling the raw rows do not give you.
Why does my spreadsheet total not match the broker?
The most common causes are double-counted rows from overlapping exports, an order that filled in several pieces being counted as several trades, and money converted at today’s exchange rate rather than the rate that applied on the day of each transaction.
What happens to my spreadsheet after a stock split?
Trading 212 records a split as two rows — a close in pre-split units and an open in post-split units. If a formula treats share counts as a running sum, everything after that date is wrong: a ten-for-one split can show a holding at a tenth of its value, or a position you sold in full as a negative number of shares.
Is Tracker 212 just a spreadsheet with a nicer interface?
No. The difference is the handling in between: fills merged back into orders, exchange rates taken from each transaction’s own date, split events applied as a ratio, cost tracked on a moving average, and duplicate rows recognised across overlapping exports. The arithmetic at the end is the easy part.
Keep the spreadsheet. Check it against this.
Import the same exports and see which of your figures move.
CSV export
What a Trading 212 CSV export actually contains, and how to turn it into your real lifetime profit and loss.
Read more →Profit & loss explained
Realised, unrealised, why a deposit is not performance — and the moments hiding in your profit line.
Read more →Portfolio tracker
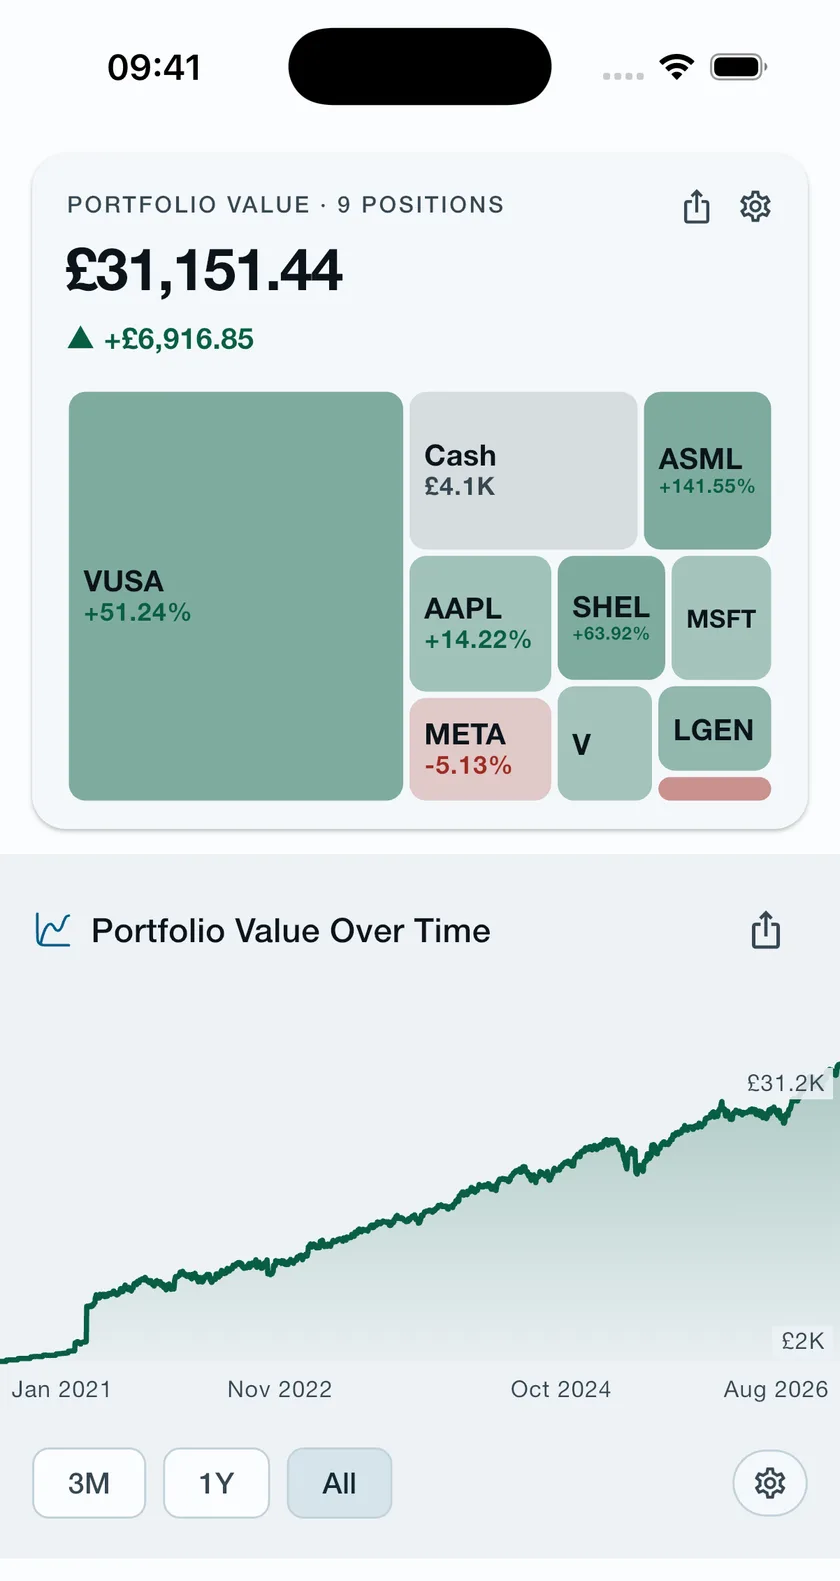
Every position you have ever held, the shape of the book as a heat map, and any past date you like.
Read more →