A portfolio tracker built for Trading 212 investors
Connect your account with a read-only API key, or import the CSV exports you already download. Tracker 212 rebuilds every buy, sell, dividend, fee and FX move since your first trade — and turns it into the number your broker never quite shows you.


Open positions, valued properly
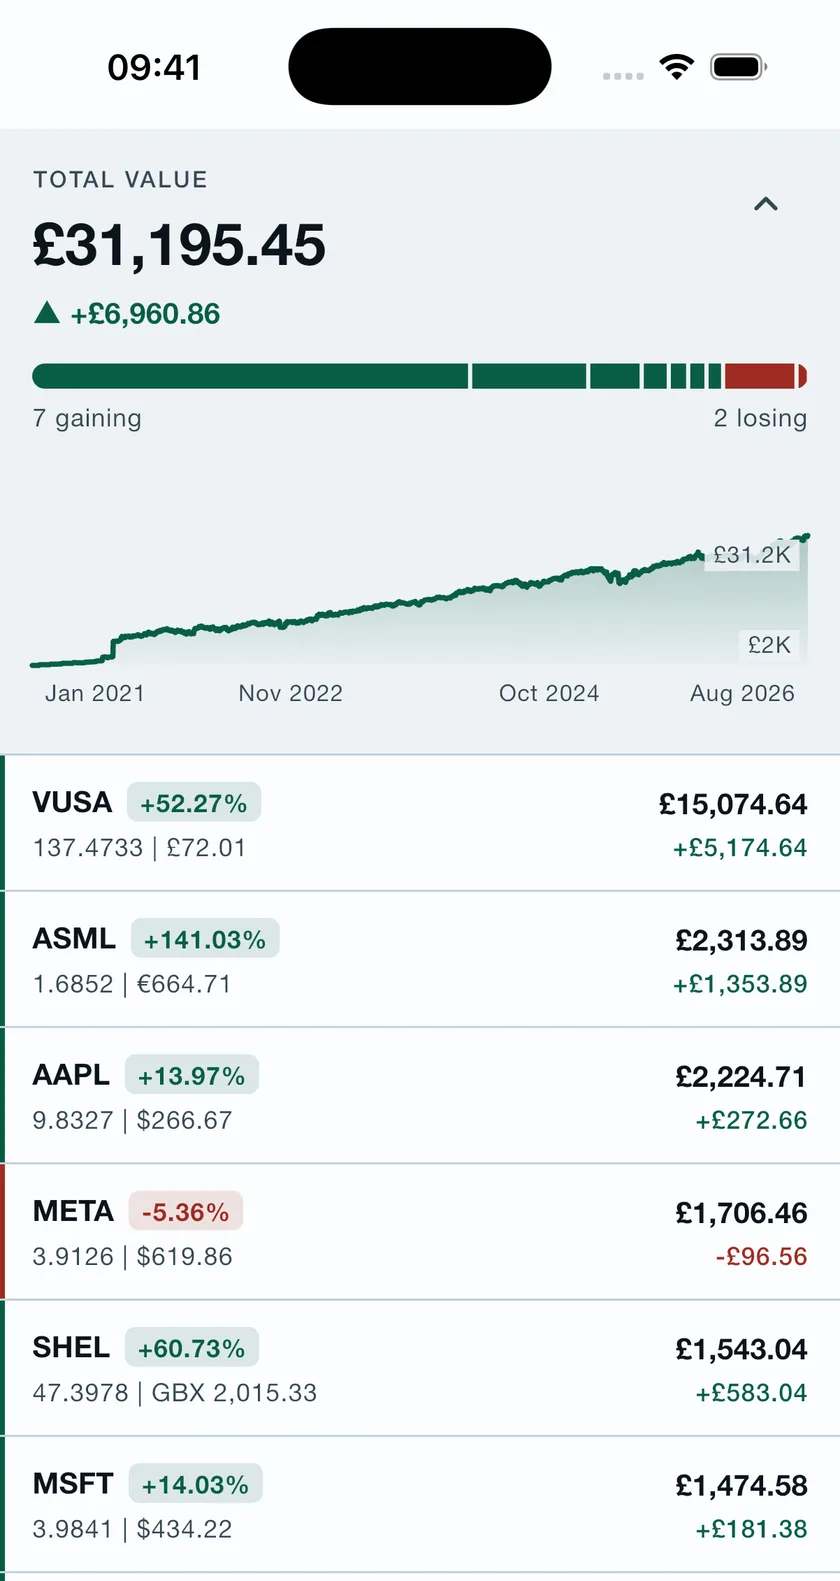
Total value with your cash balance included, unrealised profit and loss as one honest figure, and a strip showing how many positions are gaining against how many are losing.
Under it the value line starts at your first trade rather than at the day you installed the app. Every day in between is priced from a stored close and that day’s exchange rate — the same walk the Time Machine below takes one day at a time, drawn instead of read off.
The shape of the book, not a scroll of it
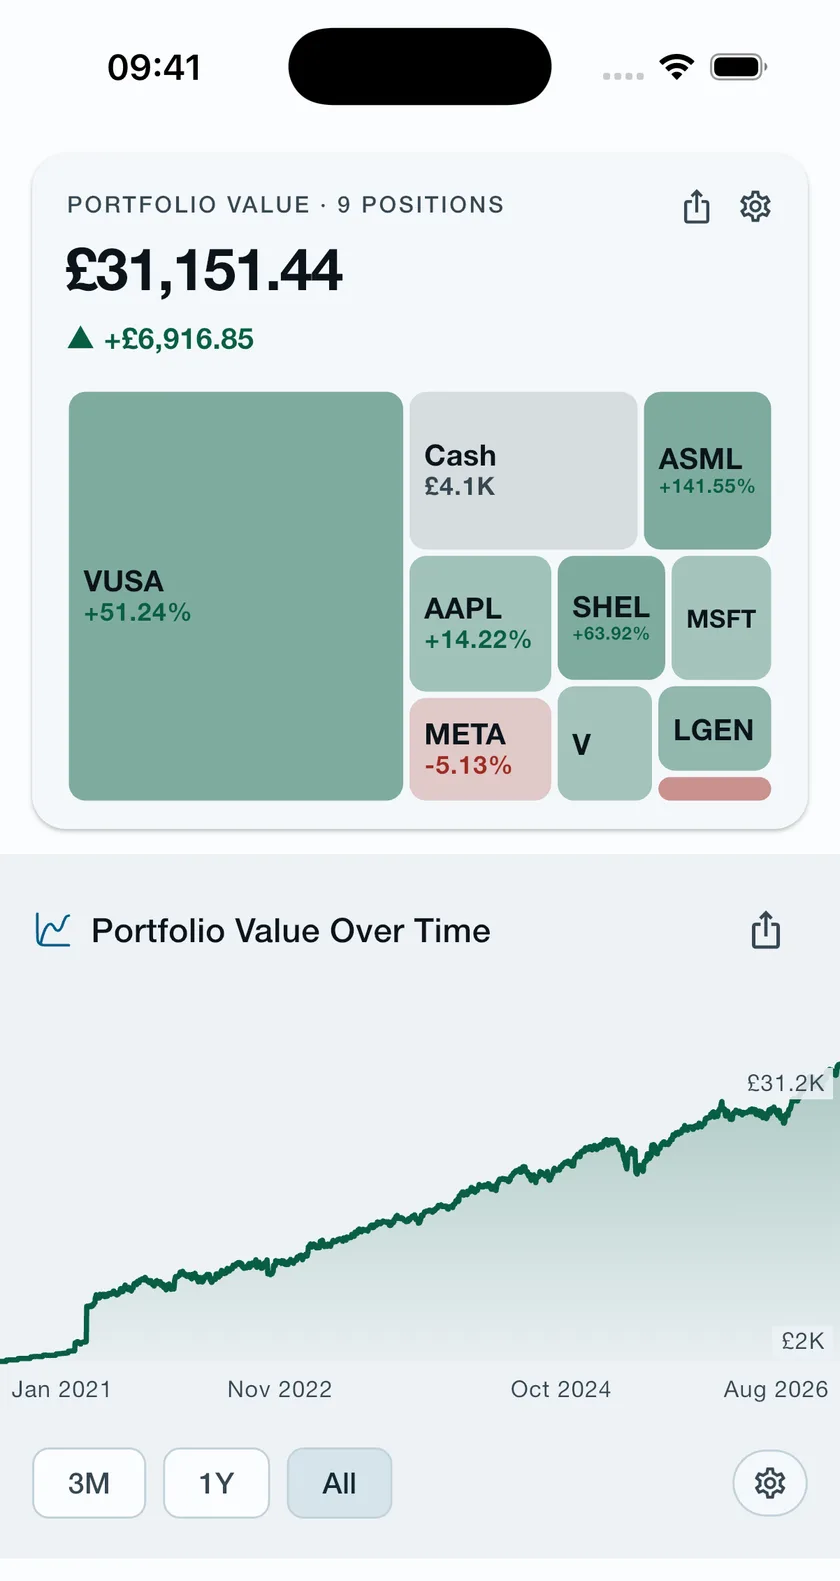
The same open positions drawn as a heat map: one tile per holding, sized by what it is worth and tinted by what it has made since you opened it. Cash gets a tile of its own, neutrally coloured, because a balance is money held rather than money made — and it is part of the total the map sits under.
A long tail of holdings too small to compare merges into a single tile rather than a row of slivers you cannot read, and a tile too small to carry its ticker carries none — an area of colour is still a true statement of size. A holding that has no price yet is left out and counted out loud instead of quietly sized at nothing.
Every position you have ever held
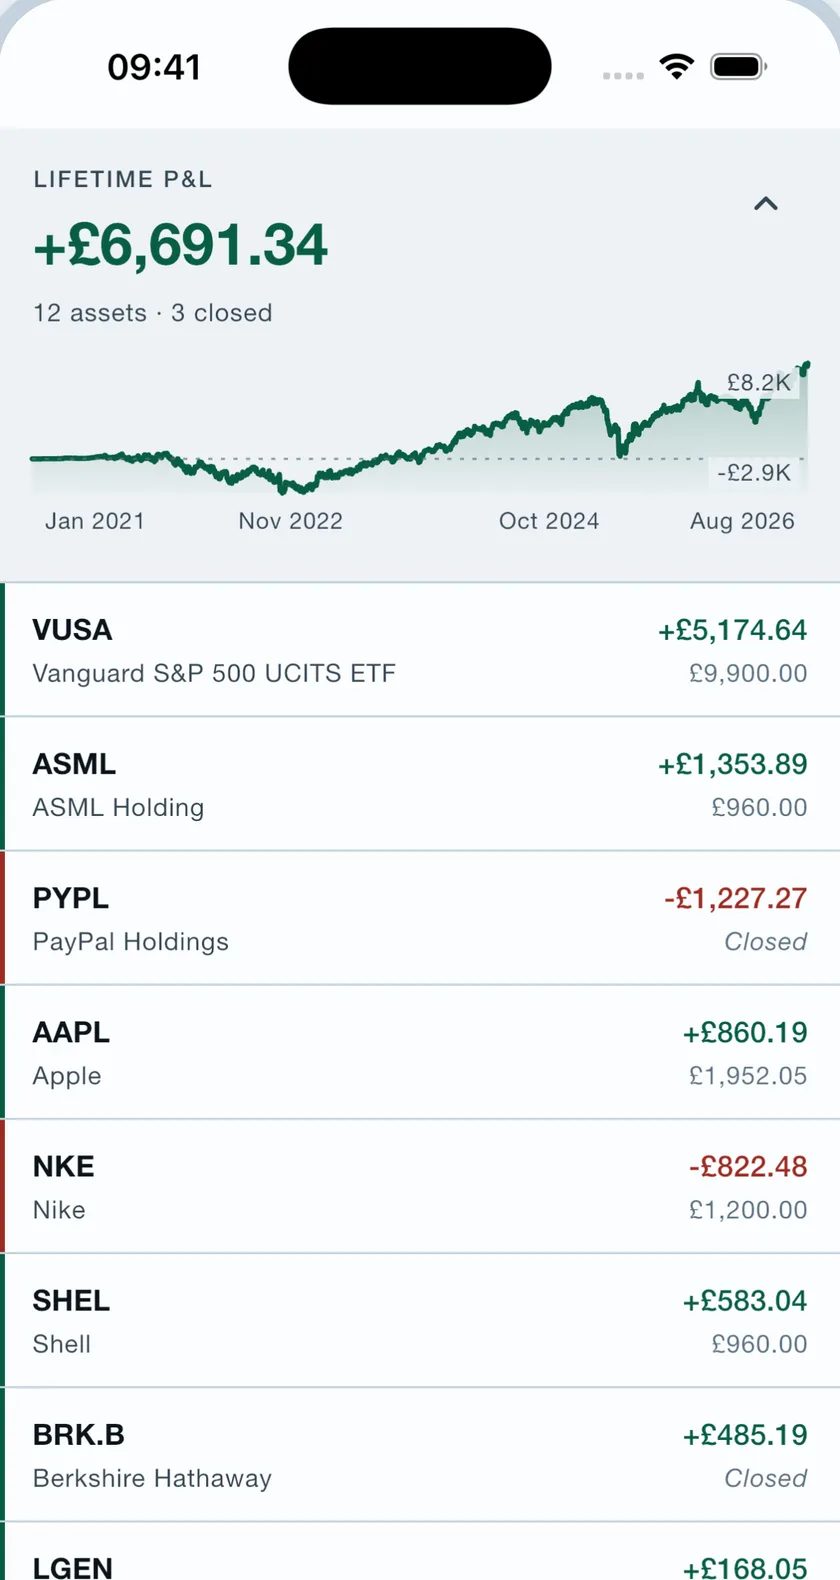
The Assets tab speaks one lifetime vocabulary: realised and unrealised combined, for everything you have ever traded. Closed positions stay on the books, because a loss you took two years ago is still part of what this portfolio did.
Sold-out positions are labelled rather than hidden, and the winners and losers are ranked by the figure the row actually shows.
Measured against the index
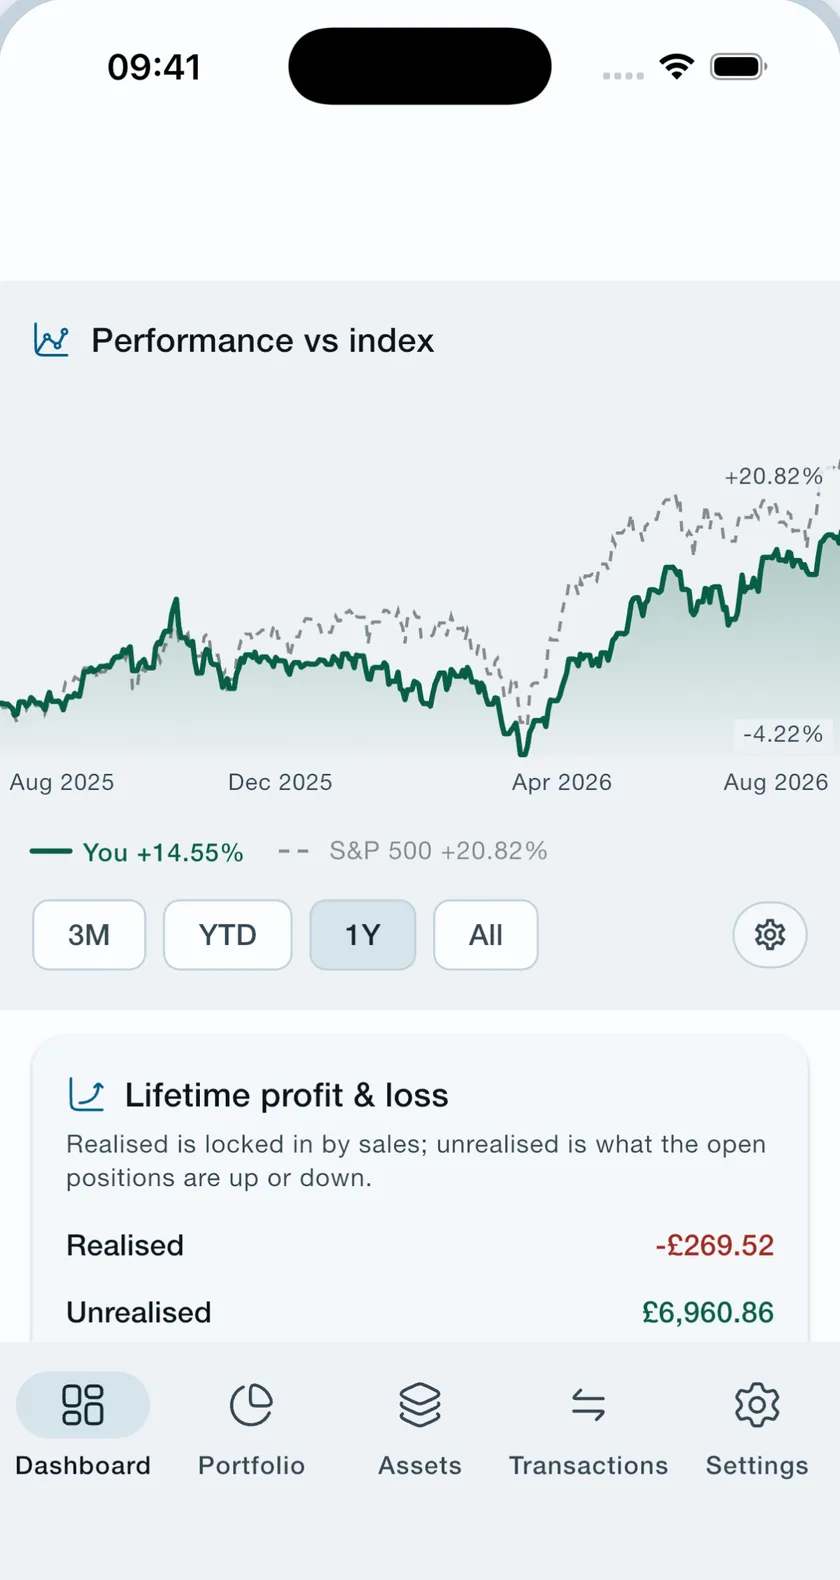
Your return is compared with an index on a time-weighted basis, so paying money in never reads as performance — a deposit makes your portfolio bigger, not better, and the comparison knows the difference.
Most portfolios do not beat the index. This one tells you either way.
Any day you like, not just today
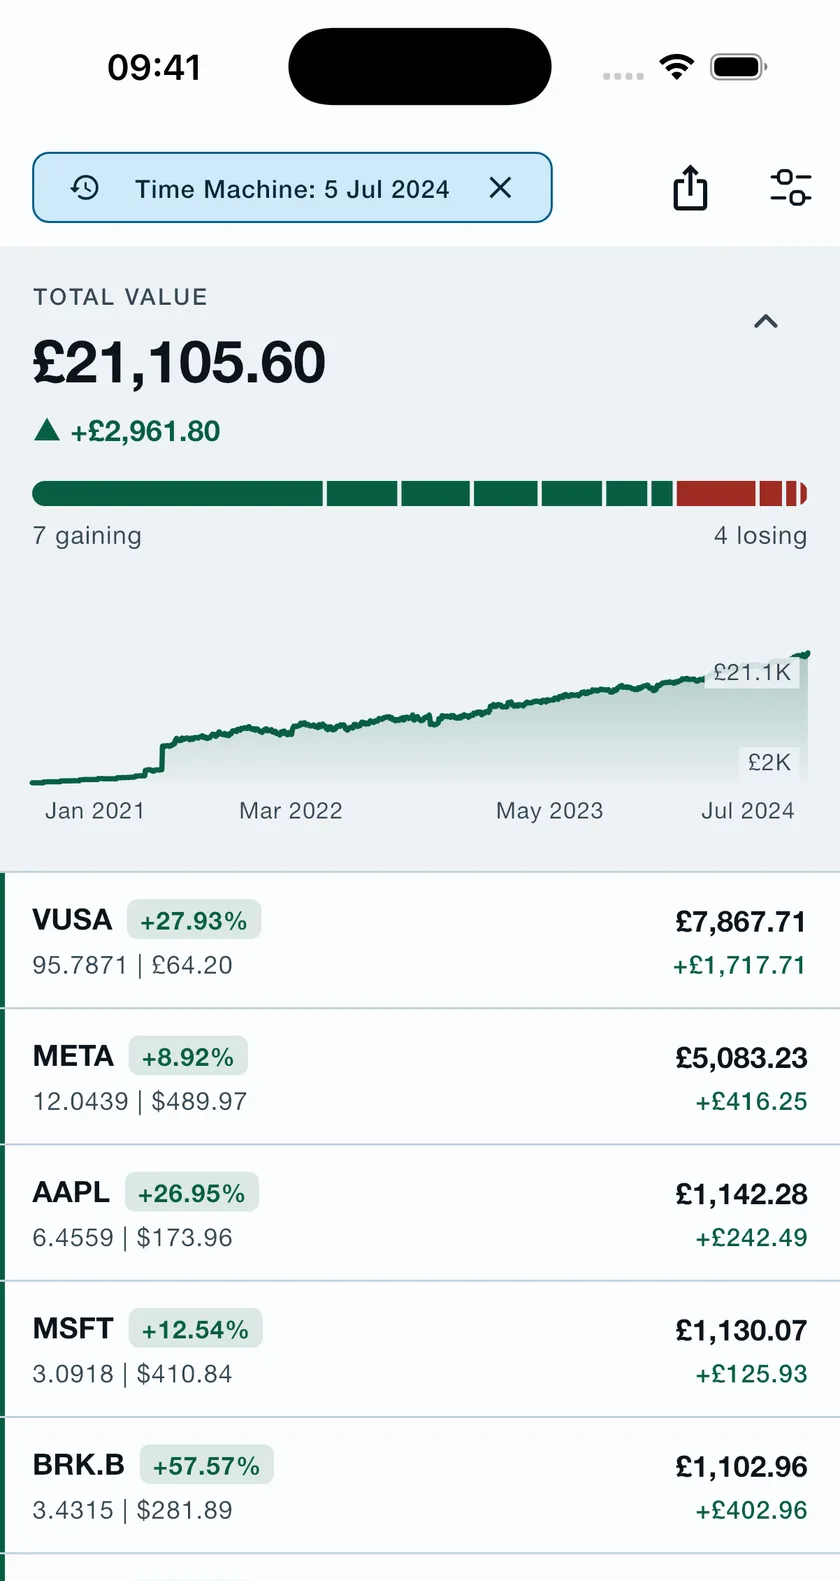
Set a date and the portfolio is valued as it stood then — through the same code path that values it now, simply asked a different question. Each holding takes the last close at or before that day and each currency the rate that applied on it, so nothing is quietly priced with this morning’s numbers.
One date drives your holdings, your assets and your transaction history together. All three answer for the same moment, which is the only way the figures on them can be compared with each other.
Every row states what you hold and what it cost on the day in question — the share count, and the average price you had paid by then, in the currency the share trades in. It is folded from the trades themselves rather than divided back out of a converted total, because undoing a historical cost with any single rate invents a price the ledger never saw.
Frequently asked questions
What does a portfolio tracker show that the broker app does not?
Your broker shows you today: what you hold now and what it is worth. Tracker 212 replays your whole history, so it can also show what you made on positions you have already closed, what every fee cost you, what your dividends add up to, and how your return compares with an index.
Does it track closed positions as well as open ones?
Yes, and they are kept apart on purpose. The Portfolio tab shows open positions in today’s terms — total value including cash, and unrealised profit and loss. The Assets tab shows everything you have ever traded, open or closed, ranked by lifetime profit and loss.
Can I see what my portfolio looked like on a past date?
Yes. Pick any date and the whole portfolio is valued as it stood then — the positions you held, what they were worth, and the exchange rates that applied on that day rather than today’s.
Which accounts and holdings does it handle?
It works from your exported history, so Invest and ISA accounts import the same way. Pie orders arrive as many small fills and are merged back into the trades you placed, fractional quantities are kept to eight decimal places, and every transaction in a foreign currency is converted at the rate that applied on its own date.
See your whole portfolio, properly.
Connect once, or bring a CSV. Your database stays on your device.
CSV export
What a Trading 212 CSV export actually contains, and how to turn it into your real lifetime profit and loss.
Read more →Read-only API key
Connect with a key that reads your history and can never place a trade.
Read more →Profit & loss explained
Realised, unrealised, why a deposit is not performance — and the moments hiding in your profit line.
Read more →